Decoding Dengue: A Comprehensive Analysis of Cases at Holy Family Hospital (2019–2023) and Anticipating Pakistan's Future Dengue Dynamics under Climate Change
Saira Karimi1, Naeem Akhtar1, Olodo Katiana2, Sajjad Haider3, Burhan Ahmed4,5, Mujeeb Khan1, Muhammad Umer1
1Department of Pathology, Rawalpindi Medical University, Rawalpindi; 2Université Cheikh Anta Diop de Dakar (UCAD), Senegal; 3Pakistan Meteorological Department, Islamabad; 4Flood Forecasting Division, Pakistan Meteorological Department, Lahore, 5Infection Disease Unit, Holy Family Hospital, Rawalpindi
Objective: Climate warming and vector born infectious diseases are a growing concern under Pakistan's recent climate warming scenario. This retrospective study considers a three-year (2019-2023) comprehensive analysis of dengue virus cases reported at Holy Family Hospital and anticipate the area’s future dengue dynamics through climate modeling.
Methodology: Patient demographic features, age, location, gender, lab profiles for Dengue Fever (DF), Dengue Shock Syndrome (DSS), and Dengue Hemorrhagic Fever (DHF), were collected and analyzed to understand the prevalence and hotspots of dengue virus.
Results: The study revealed that DF was more frequent among individuals above 50 age group, emphasizing the age-dependent nature of dengue vulnerability. Furthermore, our findings highlighted a gender-based vulnerability, indicating that males were more prone to DF (73.4%). Based on these findings, we predicted the impact of climate change (Temperature) on dengue transmission suitable days (DTSD). The proposed predictive model incorporates the baseline (2019-2023) and future (2025–2035, 2041–2070, and 2071–2099) periods under Representative Concentration Pathway (RCP4.5 and RCP8.5) scenarios. CMIP5 models, downscaled and bias-corrected with the quantile delta mapping technique, were employed to project the potential spatiotemporal shifts and DSTD due to climate change.
Conclusion: Our predictive analysis contributes to proactive public health measures by anticipating and preparing for the evolving dynamics of dengue in the context of a changing climate.
Dengue fever is caused by an arbovirus belonging to flaviviruses mainly transmitted via mosquito.1 It is one of the most rapidly spreading diseases worldwide and is becoming a public health concern affecting more than 100 million humans yearly. Dengue also causes 20 to 25,000 deaths, mainly affecting children, and exists in more than 100 countries. At the same time, the mortality rate is 1-2%. These are enveloped single-stranded RNA viruses more prevalent in tropical and subtropical areas due to optimum climatic conditions. Infection with DENV results in varying degrees of pathological conditions, ranging from mild asymptomatic dengue fever (DF) to severe dengue hemorrhagic fever (DHF) and dengue shock syndrome (DSS) which may turn fatal.1 In some cases, DF may accompany bleeding complications such as gingival bleeding, epistaxis, gastrointestinal bleeding, hematuria, and menorrhagia (in the case of women). Dengue hemorrhagic fever (DHF) is characterized by symptoms of DF along with thrombocytopenia, hemorrhagic manifestations, and plasma leakage.2 The epidemiological triangle of dengue consists of host, pathogen, and mosquito vectors (including Ae. aegypti and Ae. Albopictus) along with their interactions in the environment.3 Climate influences the propagation of dengue as the virus has to complete part of its development in the vectors responsible for disease transmission that transmit the disease. The major vectors are mosquitoes such as Aedes egypti or albopictus whose lifecycle is dependent on ambient temperature and rainfall.4 The climate is constantly changing which increases the chances to expand the geographical distribution of several mosquito-borne diseases 5. The evidence from around the areas with frequent dengue outbreaks indicate a close association between increasing incidence of dengue with rainfall, relative humidity, and temperature.6 Several studies have indicated an increase in the transmission potential of dengue fever under climate change based on the association between meteorological factors and disease transmission. Meteorological factors have an intricate influence on disease transmissions, and patterns of disease epidemics, such as epidemic size and peak time, may be subject to change under global warming.7 Climate factors such as precipitation also significantly affect the life cycle of dengue mosquitoes thus, these factors need to be included in mathematical models of dengue transmission. Furthermore. Similarly, rainfall has been shown to influence larval density and larval population size of vector of dengue.4,6,8,9 A substantial increase in the occurrence of dengue has been shown to increase globally in the last two decades (Dengue Worldwide Overview, 2022). Since 2023 an increase in dengue transmission occurred due to urbanization, the distribution pattern of vectors, and changing climate patterns. Almost five million cases and more than 5000 dengue-related deaths were reported in more than 80 countries/territories and WHO regions such as Africa, Americas, Southeast Asia, Wester, Pacific, and Eastern Mediterranean Regions globally (Dengue – Pakistan WHO (2022) including vulnerable countries such as Afghanistan, Pakistan, Sudan, Somalia, and Yemen.10 Pakistan (n= 20 072), Saudi Arabia, and Oman have reported the highest number of confirmed cases. (Dengue - Pakistan, WHO,.2023; Xu et al., 2017). Asia represents about 70% of the world’s dengue disease burden11 and has significant negative financial and sociological consequences with the potential to considerably impede the development of economies, politics, and society. In the past decade, the prevalence of dengue fever has surged globally (Khan et al., 2022.) At present, dengue is widespread in over 129 countries and cases are rising constantly over time. It has become imperative to delve into policies that can devise the dengue manifestation, detection, and future impacts at the local level.
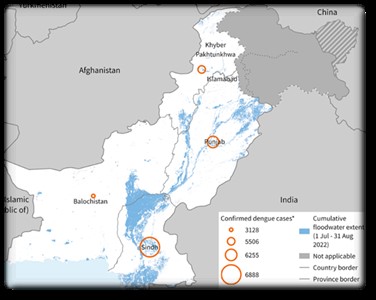
Figure 1: Distribution of confirmed dengue cases in Pakistan by province, 1 January to 22 September 2022. (adapted from World Health Organization, 2022)
Dengue incidences are constantly inflating in Pakistan with a total of 25932 confirmed dengue cases and 62 deaths (CFR 0.25%) from January to September 2022, with 74% of these cases reported in September alone (7,11). Rawalpindi-Islamabad, twin cities represent a major metropolitan area nestled in the northern region of Pakistan, within the Punjab province. The geography of the area is diverse, featuring a combination of plains and foothills of the Himalayas. While Islamabad boasts a relatively flat terrain, especially in its central areas, the landscape gradually becomes more undulating towards the Margalla Hills. Although situated near the Soan River, the cities themselves are not directly on its banks. In terms of climate, Rawalpindi-Islamabad experiences a humid subtropical climate. Summers are characterized by hot and dry weather, with temperatures often soaring above 40°C (104°F) during the peak months of June and July. Winters are mild, with temperatures rarely dropping below freezing point. From 2011 to 2017, the appropriate temperature for dengue outbreaks was found to be 30 °C while observing the association between dengue outbreaks and climate.12 Pakistan when the mean monthly temperature was approximately 30.32 °C, a high number of cases were found, but when the temperature was >30 °C, the dengue fever cases were exceedingly modest.13 The area witnesses a distinct wet season during the monsoon months of July and August, marked by heavy rainfall and occasional thunderstorms. Humidity levels remain moderate to high, especially during the monsoon season, contributing to discomfort during the hot weather.14 The twin cities have undergone significant urbanization and development over the years. Islamabad was purposefully constructed as the capital city of Pakistan in the 1960s and is renowned for its well-planned layout and abundance of green spaces. Today, the combined population of Rawalpindi-Islamabad is several million, making it one of the most populous urban areas in the country. The infrastructure of the area is well-developed, featuring modern amenities, educational institutions, healthcare facilities, and a variety of commercial and recreational activities, catering to the diverse needs of its residents and visitors alike.
In the study area of Rawalpindi-Islamabad, the impact of temperature on dengue fever incidence is a significant concern, influenced by the region's specific climatic conditions and urban landscape. Research indicates that temperature plays a crucial role in the survival, reproduction, and transmission dynamics of Aedes mosquitoes, the primary vectors responsible for spreading the dengue virus. Studies such as have highlighted how warmer temperatures can accelerate the development of mosquito populations, leading to higher vector densities and increased dengue transmission risk.15 Moreover, temperature affects the replication rates of the dengue virus within mosquitoes. "Climate Change and the Global Spread of Dengue Fever: A Meta-Analysis" by Yang et al., (2019) demonstrated that higher temperatures can shorten the extrinsic incubation period of the virus, accelerating its multiplication within mosquitoes and enhancing its transmissibility. This phenomenon underscores the role of temperature in shaping the transmission cycle of dengue, potentially leading to more frequent and severe outbreaks in regions experiencing warmer climates. Human behavior also interacts with temperature to influence dengue transmission dynamics. During periods of hot weather, individuals may spend more time outdoors, increasing their exposure to mosquito bites. Additionally, "Climate Change, Dengue, and Other Arboviruses: A Review of the Evidence" by Kovats et al., (2013) suggests that higher temperatures may lead to decreased use of protective measures such as long clothing or mosquito repellents, further elevating the risk of dengue infection among susceptible populations. In urban areas like Rawalpindi-Islamabad, where water storage practices are common due to intermittent water supply, temperature can exacerbate the proliferation of Aedes mosquitoes. Warmer temperatures accelerate the development of mosquito larvae in water containers, contributing to increased vector abundance and dengue transmission risk in residential areas. Furthermore, the region's distinct seasonal variations, characterized by hot summers and monsoon rains, play a crucial role in shaping the impact of temperature on dengue dynamics. The study "Temperature Variability and Dengue Fever: Evidence from 20 Years of Surveillance Data in Guangzhou, China" by Zhang et al., (2019) highlights how high temperatures during the summer months and heavy rainfall during the monsoon season create favorable conditions for mosquito breeding and dengue transmission, leading to spikes in dengue cases. The analysis presented in this study is structured to provide a thorough examination of the recent advances in dengue detection, the prevalence rates observed at Holy Family Hospital, and the demographic characteristics of the affected population. By categorizing data based on gender, age, district, and abundance of cases, we aim to unravel patterns that may inform not only clinical practices, but also public health policies tailored to the specific needs of the Rawalpindi community. In essence, this study will contribute to the global discourse on dengue fever by providing a localized perspective.
Our research area, consisting of Rawalpindi and Islamabad, is a major metropolitan region situated in the northern part of Pakistan, specifically in the Punjab province. The area's geography is varied, with a mix of plains and the foothills of the Himalayas. The terrain of Islamabad is mostly flat, particularly in its central areas, but it gradually becomes hillier towards the Margalla Hills. Despite being near the Soan River, the cities are not situated directly on its banks. A search strategy was formulated to comprise diagnoses conducted at Holy Family Hospital during the years 2019 to 2023, with a focus on positive cases of DF, DHF, and DSS. The inclusion criteria encompassed studies that reported on the prevalence of dengue fever, employed NS1 antigen, IgG, and IgM detection methods, and offered sufficient demographic information. Data extraction was executed systematically to capture pertinent information from the selected studies. Variables of interest included the number of dengue cases, gender distribution, age distribution, district-wise distribution, and diagnostic techniques employed. The data extraction was performed independently, and any discrepancies were reconciled through consensus. The extracted data were subjected to a robust statistical analysis to unravel trends and patterns in the prevalence of dengue fever. Categorization of data was performed based on gender, age, and district, with further exploration of the abundance of cases. Descriptive statistics, chi-square testing, and logistic regression analysis using R programming were applied. Gender-specific prevalence rates were examined to identify any notable variations. Pie charts were employed to illustrate the overall distribution of dengue cases, emphasizing the proportion of each infection type. Mapping tools were employed to visualize the data of age, gender, and frequency of disease at different locations of Rawalpindi to estimate the total disease burden and its socio-economic details employed on in our study focusing on identifying suitable transmission days for dengue fever, we leveraged temperature data from both historical records and future projections obtained from the RCA4 CORDEX South Asia dataset. This dataset enabled us to examine temperature patterns over past periods as well as project potential future scenarios, providing essential insights into the environmental conditions conducive to dengue transmission. By utilizing this comprehensive temperature data, which covers historical periods and future projections, we aimed to better understand the relationship between temperature fluctuations and the suitability of conditions for dengue transmission. This analysis allowed us to identify periods with optimal temperature conditions for the proliferation of dengue vectors, aiding in the assessment of dengue risk and the development of targeted intervention strategies. In our research, we employed a combination of statistical bias correction and downscaling techniques to enhance the accuracy and resolution of climate data used in our study. Statistical bias correction involves adjusting climate model outputs to reduce systematic errors or biases relative to observations. This process ensures that the simulated climate variables align more closely with historical data, improving the reliability of future projections. Additionally, we utilized downscaling methods to refine the spatial and temporal resolution of climate model outputs. Downscaling involves generating finer-scale climate information from coarser-resolution global climate models or reanalysis datasets. By downscaling the data, we were able to capture local-scale variations in climate variables, which are essential for assessing the impacts of climate change on regional and local scales. The combined approach of statistical bias correction and downscaling allowed us to produce high-quality climate data suitable for our specific research objectives. These refined climate datasets provided a more accurate representation of past climate conditions and enabled robust projections of future climate scenarios, facilitating a comprehensive analysis of the potential impacts of climate change on dengue transmission dynamics. To empirically adjust variable biases originating from regional climate model simulations we used the widely used quantile mapping approach (Gudmundsson et al., 2012). We identified shape distributions of different quantile mapping methods. Afterwards, investigation of the most appropriate distribution of the quantile mapping based on the least biases was executed (Burhan and Rasul, 2018). The selected statistical transformation strived to acquire a function that mapped a modeled parameter Pm such that its post-processed distribution equaled the distribution of the observed parameter Po. Adhering to Piani et al. (2010), we deployed a generic transformation
expressed as in Eqn. (1) and (2). In the following mathematical expressions for the quantile mapping approach, the parameters Po and Pm indicate observed and modeled climatic variables, respectively
Po=c(Pm) (1)
Po= Fo-1 (Fm (Pm)) (2)
where Fm is the Cumulative Distribution Function (CDF) of Pm and Fo−1 is the inverse CDF (or quantile function) linking to Po.
Disease burden and distribution of Dengue fever (DF), Dengue Hemorrhagic Fever (DHF), and dengue shock syndrome (DSS) in different areas of Rawalpindi shows that in central pindi the abundance of dengue fever was more as compared to the other parts of the district (Table I, Figure 2).

Figure 2: The area-wise distribution of 3 types of dengue fever and disease burden in Rawalpindi district showcasing the hotspots of dengue. DF was the most abundant and reported type of fever.
Figure 2 illustrates the demographic details of the 5,242 dengue patients reported in 2019-2023, including their socioeconomic status (SES) and other associated risk factors.
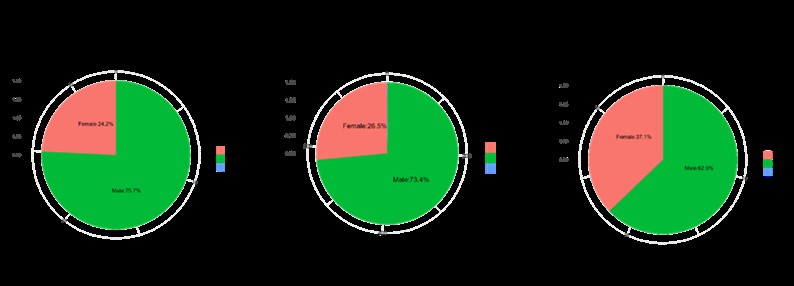
Figure 3: Susceptibility and Disease Distribution among males and females. According to analysis, Males exhibit a significant propensity for dengue virus infection, which may account for the high incidence of DF, DHF and DSS cases in this population.
Table I: Month wise distribution of dengue-positive cases in holy Family hospital from 2019-2023 |
|||||||||||||
Year |
Jan |
Feb |
Mar |
Apr |
May |
Jun |
Jul |
Aug |
Sep |
Oct |
Nov |
Dec |
Total |
2019 |
0 |
0 |
0 |
0 |
1 |
2 |
27 |
684 |
4686 |
5581 |
961 |
0 |
1192 |
2022 |
0 |
0 |
2 |
0 |
0 |
5 |
9 |
420 |
1912 |
2106 |
565 |
20 |
5039 |
2023 |
0 |
0 |
1 |
1 |
3 |
9 |
25 |
148 |
185 |
- |
- |
- |
372 |
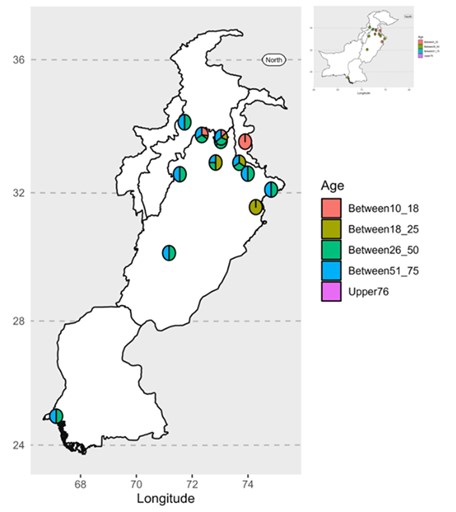
Figure 4: Geospatial Analysis of Dengue Fever (DF) Distribution Across Age Groups in Rawalpindi District.
Dengue fever DF, DHF and DSS was more common in males (73.4%) and in people aged between 51-75 years (p < 0.001) Figure 4.
Based on hospitalization data, dengue patients were most frequently hospitalized in October and September, with the lowest rates occurring in June. The data also revealed a significant correlation between the incidence of dengue and the season, particularly when analyzed by age group and month. Looking at Figure 2 and 3, Rawalpindi had the highest number of reported dengue cases and deaths compared to other districts. Out of 5,242 confirmed cases and 10 deaths, Rawalpindi alone had 3,139 cases and three deaths (p < 0.001).
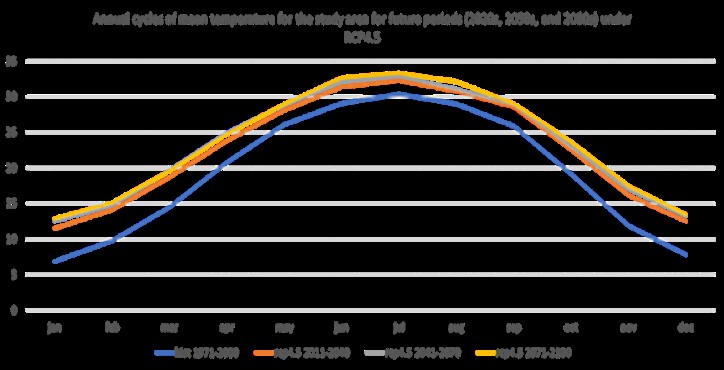
Figure 5: illustrates the annual cycle of mean temperature for each month of the study for baseline (1971–2000) and future periods (2020s: 2006–2035, 2050s: 2041–2070, 2071–2100) of 14 ensemble GCMs under RCP4.5 and RCP8.5.
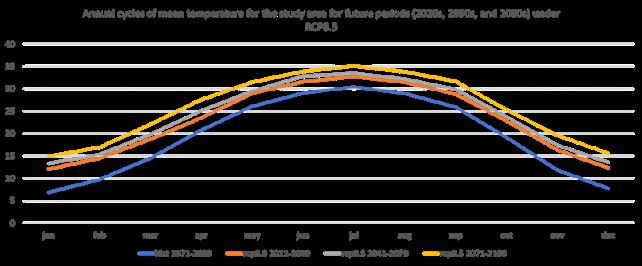
Figure 6: Annual climatology Historical versus RCP8.5
The other districts reported significantly fewer cases and deaths. This makes Rawalpindi the "dengue hot-spot district" with a high number of dengue cases recorded between 2019 and 2023 (p < 0.001). Temperature plays a significant role in the transmission of dengue fever. According to the graph (Figure 5), fluctuations in temperature directly impact the likelihood of dengue outbreaks. The risk of transmission follows a pattern that resembles an inverted U-shape Figure 6, with the highest risk associated with temperatures ranging from 28°C to 32°C. As temperatures exceed 32°C, other factors, such as the duration of the human infectious period, become increasingly important and may affect control measures.16,17 Figure 5 and Figure 6 visually represents the annual cycles of mean temperature for the study area across four different time periods, using the RCP4.5 scenario.

Figure 7: Change in distribution of frequency of DSTD under RCP4.5 emission scenario
Despite minor variations, all periods follow a similar pattern, with temperature peaking in July and reaching a minimum in January. The projected temperatures for future periods are higher than historical data Figure 7, 8, indicating an ongoing increase in average temperatures over time, likely due to the effects of global warming and climate change.13-15 RCP4.5 is a scenario that assumes global annual greenhouse gas emissions in CO2-equivalents will peak around 2040, with a significant decline thereafter.17
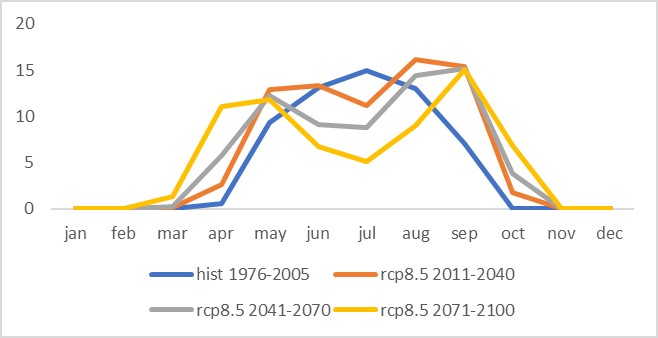
Figure 8: Change in distribution of frequency of DSTD under RCP8.5 emission scenario
According to multiple studies, the temperature in Islamabad-Rawalpindi is likely to increase significantly under the high emissions scenario RCP8.5 in comparison to the moderate emissions pathway RCP4.5.18 Studies have found that Islamabad and its surroundings are projected to experience a notable warming trend under RCP8.5, which represents a continued high greenhouse gas emission trajectory.19 It was studied that climate projections for Pakistan under different emission scenarios and highlighted the substantial temperature increases expected by the end of the century under RCP8.5.19,20 Similarly, Islamabad's climate projections emphasized the heightened temperature rise under RCP8.5 compared to RCP4.5.17,21-23 These studies underscore the significance of accounting for emission scenarios when evaluating future climate impacts on Islamabad. The high emissions trajectory of RCP8.5 indicates a more severe warming trend, which poses greater challenges for the city in terms of heat stress, water availability, and ecosystem resilience. In contrast, RCP4.5 represents a pathway with moderated emissions due to mitigation efforts, resulting in a comparatively lower rate of temperature increase.24 Although this still leads to warming and associated impacts, the magnitude and severity are expected to be less pronounced compared to RCP8.5.25 The chart depicts the annual temperature cycles in Islamabad-Rawalpindi for historical and future periods, assuming scenario RCP8.5. The pattern of each line is similar, with temperatures increasing from January, reaching a peak in June, and then decreasing towards December. However, the temperatures in future periods appear to be higher than in the past, indicating an overall increase in mean temperatures. This graph is a typical representation of climate change projections, with RCP8.5 being just one of the possible scenarios for future climate. This particular scenario assumes the highest greenhouse gas emissions compared to other pathways. Mean temperatures will likely increase even more under RCP8.5 than under RCP4.5, exacerbating the effects of climate change in the studied area. All of the future projections show higher temperature ranges than historical observations.9,17,19-21
Climate projections for Islamabad indicate that the shoulder seasons, which include spring and autumn, are likely to experience higher mean temperature changes in comparison to the summer season.26 Temperature trends across different seasons were analyzed by Amnuaylojaroen et al., 2022; Hausfather & Peters, 2020; Sharif et al., 2024, their finding suggested that while summer temperatures are expected to increase, the rate of temperature rise during the shoulder seasons, particularly in spring and autumn, is projected to be even higher. Ali et al. (2020) also found significant temperature changes anticipated during the shoulder seasons, with potentially greater impacts on local ecosystems, agriculture, and human health.26
Research studies indicate that the climate change effects on the transmission of dengue fever in Islamabad-Rawalpindi are alarming.29 The projected periods under both RCP8.5 and RCP4.5 scenarios are expected to significantly increase the season favorable for dengue transmission. Analysis of the impact of various emission scenarios on dengue suitability in Islamabad and found that the season conducive to dengue transmission is projected to increase substantially in the future.16,17,30 Similarly, when examined the impact of climate change on dengue transmission dynamics it was concluded that regardless of the emissions trajectory, the period characterized by suitable temperature conditions for dengue transmission is expected to expand significantly. This expansion of the dengue transmission period poses significant challenges for dengue control and public health efforts.30
Recent research suggests that the incidence of DSTD may rise during the transitioning months, while decreasing in the summer.17 When projected to analyze the link between climate change and dengue fever it was indicate that the number of days with temperatures suitable for dengue transmission is expected to increase notably in spring and autumn.5,16 Similarly, analyzed a significant decrease in the frequency of dengue-suitable temperature days during the summer, but a rise in spring and autumn. Recent analyses have revealed that days with suitable temperature for dengue fever in Islamabad have historically followed a unimodal pattern, meaning there was a single peak during a specific season. However, future projections indicate a shift towards a bimodal pattern, which means that there will be increased occurrences of the disease during both spring and autumn. This shift is caused by the historical unimodal pattern converting to bimodal, which means that both transitioning seasons are expected to exhibit higher occurrences of the disease. This shift can create an alarming situation, leading to a surge in patients at the Holy Family Hospital.
This study emphasizes the importance of considering seasonal variations and the potential impacts of climate change on dengue transmission dynamics. The shift towards a bimodal pattern indicates a significant change in the timing and distribution of dengue-suitable temperature days, which has implications for dengue control strategies and public health interventions in Islamabad-Rawalpindi. Adapting surveillance and vector control measures to account for the increased occurrences during spring and autumn will be crucial for effectively managing dengue transmission in the future. Understanding these shifting patterns can inform policymakers and public health authorities in developing targeted strategies to mitigate the impacts of climate change on dengue incidence in Islamabad and ensure the health and well-being of the population.
- Guzman MG, Fuentes O, Martinez E, Perez AB. Dengue. Int Encycl Public Heal. 2016 Oct 6;233–57. https://doi.org/10.1038%2Fnrmicro2460
- Beltz LA. Dengue Virus. Zika Other Neglected Emerg Flaviviruses [Internet]. 2021 [cited 2024 Apr 16];19–39. Available from: https://linkinghub.elsevier.com/retrieve/pii/B9780323825016000025
- Deng SZ, Jalaludin BB, Antó JM, Hess JJ, Huang CR. Climate change, air pollution, and allergic respiratory diseases: A call to action for health professionals [Internet]. Vol. 133, Chinese Medical Journal. Lippincott Williams and Wilkins; 2020 [cited 2021 Mar 26]. p. 1552–60. https://doi.org/10.1097%2FCM9.0000000000000861
- Islam S, Emdad Haque C, Hossain S, Hanesiak J. Climate variability, dengue vector abundance and dengue fever cases in dhaka, bangladesh: A time-series study. Atmosphere (Basel) [Internet]. 2021 Jul 1 [cited 2024 Apr 16];12(7):905. https://doi.org/10.3390/atmos12070905
- Stewart Ibarra AM, Ryan SJ, Beltrán E, Mejía R, Silva M, Muñoz Á. Dengue Vector Dynamics (Aedes aegypti) Influenced by Climate and Social Factors in Ecuador: Implications for Targeted Control. PLoS One [Internet]. 2013 Nov 12 [cited 2024 Apr 16];8(11):e78263. https://doi.org/10.1371/journal.pone.0078263
- Abdullah NAMH, Dom NC, Salleh SA, Salim H, Precha N. The association between dengue case and climate: A systematic review and meta-analysis. One Heal [Internet]. 2022 Dec 1 [cited 2024 Apr 16]; 15:100452. https://doi.org/10.1016%2Fj.onehlt.2022.100452
- Messina JP, Brady OJ, Golding N, Kraemer MUG, Wint GRW, Ray SE, et al. The current and future global distribution and population at risk of dengue. Nat Microbiol. 2019 Sep 1;4(9):1508–15. https://doi.org/10.1038/s41564-019-0476-8
- Messina JP, Brady OJ, Golding N, Kraemer MUG, Wint GRW, Ray SE, et al. The current and future global distribution and population at risk of dengue. Nat Microbiol. 2019 Sep 1;4(9):1508–15. https://doi.org/10.1038/s41564-019-0476-8
- Naish S, Dale P, Mackenzie JS, McBride J, Mengersen K, Tong S. Climate change and dengue: A critical and systematic review of quantitative modelling approaches. BMC Infect Dis [Internet]. 2014 Mar 26 [cited 2024 Apr 16];14(1):1–14. https://doi.org/10.1186/1471-2334-14-167
- Nathan MB, Dayal-Drager R, Guzman M. Dengue: guidelines for diagnosis, treatment, prevention, and control. 2009 [cited 2024 Apr 16]. p. 3–21 Epidemiology, burden of disease and transmission. Available from: https://www.ncbi.nlm.nih.gov/books/NBK143159/
- World Health Organization. Disease Outbreak News. 2022 [cited 2024 Apr 16]. Dengue - Pakistan. Available from: https://www.who.int/emergencies/disease-outbreak-news/item/2022-DON414
- Shabbir W, Pilz J, Naeem A. A spatial-temporal study for the spread of dengue depending on climate factors in Pakistan (2006-2017). BMC Public Health [Internet]. 2020 Jun 25 [cited 2024 Apr 18];20(1):995. https://doi.org/10.1186/s12889-020-08846-812. Shabbir W, Pilz J, Naeem A. A spatial-temporal study for the spread of dengue depending on climate factors in Pakistan (2006-2017). BMC Public Health [Internet]. 2020 Jun 25 [cited 2024 Apr 18];20(1):995. https://doi.org/10.1186/s12889-020-08846-8
- Abbas S, Ilyas M. Assessing the impact of EI Niño southern oscillation index and land surface temperature fluctuations on dengue fever outbreaks using ARIMAX(p)-PARX(p)-NBARX(p) models. Arab J Geosci. 2018 Dec 1;11(24). http://dx.doi.org/10.1007/s12517-018-4119-9
- Otto FEL, Zachariah M, Saeed F, Siddiqi A, Kamil S, Mushtaq H, et al. Climate change increased extreme monsoon rainfall, flooding highly vulnerable communities in Pakistan. Environ Res Clim. 2023 Jun 1;2(2):025001. http://dx.doi.org/10.1088/2752-5295/acbfd5
- Nguyen LT, Le HX, Nguyen DT, Ho HQ, Chuang TW. Impact of Climate Variability and Abundance of Mosquitoes on Dengue Transmission in Central Vietnam. Int J Environ Res Public Health [Internet]. 2020 Apr 1 [cited 2024 Apr 21];17(7). https://doi.org/10.3390%2Fijerph17072453
- Akram MI, Akram W, Qayyoum MA, Rana AA, Yasin M, Saddiq B. Vector indices and metrological factors associated with dengue fever outbreak in Punjab, Pakistan. Environ Dev Sustain [Internet]. 2023;25(9):9839–50. https://doi.org/10.1007/s10668-022-02462-9
- Saeed A, Ali S, Khan F, Muhammad S, Reboita MS, Khan AW, et al. Modelling the impact of climate change on dengue outbreaks and future spatiotemporal shift in Pakistan. Environ Geochem Health [Internet]. 2023;45(6):3489–505. https://doi.org/10.1007/s10653-022-01429-z
- Chaudhry QUZ. CLIMATE CHANGE PROFILE OF PAKISTAN Climate Change Profi le of Pakistan. Asian Dev Bank [Internet]. 2017 [cited 2024 Apr 22];30–5. https://dx.doi.org/10.22617/TCS178761
- Kiani RS, Ali S, Ashfaq M, Khan F, Muhammad S, Reboita MS, et al. Hydrological projections over the Upper Indus Basin at 1.5 °C and 2.0 °C temperature increase. Sci Total Environ. 2021 Sep 20; 788:147759. https://doi.org/10.1016/j.scitotenv.2021.147759
- Khan F, Ali S, Ullah H, Muhammad S. Twenty-first century climate extremes’ projections and their spatio-temporal trend analysis over Pakistan. J Hydrol Reg Stud. 2023 Feb 1; 45:101295. http://dx.doi.org/10.1016/j.ejrh.2022.101295
- Bint-e-Mehmood D, Awan JA, Farah H. Modelling temperature and precipitation variabilities over semi-arid region of Pakistan under RCP 4.5 and 8.5 emission scenarios. Model Earth Syst Environ. 2024 Feb 1;10(1):143–55. http://dx.doi.org/10.1007/s40808-023-01776-5
- Lake IR, Jones NR, Agnew M, Goodess CM, Giorgi F, Hamaoui-Laguel L, et al. Climate change and future pollen allergy in Europe. Environ Health Perspect [Internet]. 2017 [cited 2021 Aug 15];125(3):385–91. https://doi.org/10.1289%2FEHP173
- Amin A, Nasim W, Mubeen M, Ahmad A, Nadeem M, Urich P, et al. Simulated CSM-CROPGRO-cotton yield under projected future climate by SimCLIM for southern Punjab, Pakistan. Agric Syst [Internet]. 2018 May 27 [cited 2017 Dec 28]; 167:213–22. https://doi.org/10.1016/j.agsy.2017.05.010
- Amnuaylojaroen T, Limsakul A, Kirtsaeng S, Parasin N, Surapipith V. Effect of the Near-Future Climate Change under RCP8.5 on the Heat Stress and Associated Work Performance in Thailand. Atmos 2022, Vol 13, Page 325 [Internet]. 2022 Feb 15 [cited 2024 Apr 22];13(2):325. https://doi.org/10.3390/atmos13020325
- Khan J, Adil M, Wang G, Tsheten T, Zhang D, Pan W, et al. A cross-sectional study to assess the epidemiological situation and associated risk factors of dengue fever; knowledge, attitudes, and practices about dengue prevention in Khyber Pakhtunkhwa Province, Pakistan. Front Public Heal. 2022 29;10. https://doi.org/10.3389%2Ffpubh.2022.923277
- Shahzad L, Tahir A, Dogar M, Saeed S. A metric-based assessment of climate and tourism in major cities of Pakistan. Environ Dev Sustain. 2021 Sep 1;23(9):13607–27. https://link.springer.com/article/10.1007/s10668-021-01230-5
- Sharif F, Shahzad L, Batool M. The association between climatic factors and waterborne infectious outbreaks with a focus on vulnerability in Pakistan: integrative review. Int J Environ Health Res [Internet]. 2024 Jan 10 [cited 2024 Apr 22]; https://doi.org/10.1080/09603123.2024.2302040
- Hausfather Z, Peters GP. RCP8.5 is a problematic scenario for near-term emissions. Proc Natl Acad Sci U S A. 2020 Nov 10;117(45):27791–2. https://doi.org/10.1073%2Fpnas.2017124117
- Wang Y, Zhao S, Wei Y, Li K, Jiang X, Li C, et al. Impact of climate change on dengue fever epidemics in South and Southeast Asian settings: A modelling study. Infect Dis Model [Internet]. 2023 Sep 1;8(3):645. https://doi.org/10.1016/j.idm.2023.05.008
- Noreen N. Effect of climatic factors favoring dengue transmission in Islamabad Capital Territory, Pakistan, 2022. Popul Med [Internet]. 2023 Apr 27 [cited 2024 Apr 22];5(Supplement):98–98. https://doi.org/10.18332/popmed/165431
- Liu Z, Zhang Q, Li L, He J, Guo J, Wang Z, et al. The effect of temperature on dengue virus transmission by Aedes mosquitoes. Front Cell Infect Microbiol https://doi.org/10.3389%2Ffcimb.2023.1242173

An Official Publication of
Islamabad Medical & Dental College
Volume 13 Issue 2
Address of Correspondence
Saira Karimi
Email:
saira.karimi@rmur.edu.pk
Authors’ Contribution: 1,2Conception; Literature research; manuscript design and drafting; 3,4,5 Critical analysis and manuscript review; 6,7Data analysis; Manuscript Editing.
Cite this article. Karimi S, Akhtar N, Katiana O, Haider S, Ahmed B, Khan M, Umer M Decoding Dengue: A Comprehensive Analysis of Cases at Holy Family Hospital (2019–2023) and Anticipating Pakistan's Future Dengue Dynamics under Climate Change. J Islamabad Med Dental Coll. 2024; 13(2): 345-354. DOI: https://doi.org/10.35787/jimdc.v13i2.1262