Seasonal trends of Influenza in Islamabad, Pakistan
Sania Raza1, Muhammad Usman2, Imran Ahmad3
1 Associate Consultant, Pathology Laboratory, Shifa International Hospital, Islamabad Pakistan
2 Consultant, Pathology Laboratory, Shifa International Hospital, Islamabad Pakistan
3 Chief Pathologist, Pathology Laboratory, Shifa International Hospital, Islamabad Pakistan
Background:
Viral outbreaks have always been a challenging task for clinicians and Influenza virus has been on top of the list. The history of influenza epidemic reveals its devastating effects in the form of multiple deaths and economic burden. Hence this study was planned to recognize the peak activity time span of Influenza infection and its frequency in our set-up at Shifa International Hospital, Islamabad Pakistan.
Material and Methods: A cross sectional study was performed in Pathology Laboratory, Shifa international hospital Islamabad from April 2016 to March 2019. Nasopharyngeal swabs were collected from patients of all age groups, with clinically suspected influenza infection throughout the year, irrespective of gender, according to hospital’s standard policy. Samples were analysed on GeneXpert kit (Xpert Flu Assay). Data collected was entered and then analysed in SPSS version 17.
Results: Of the total 591 samples included in study, 233 (39.4%) were positive for influenza (Flu A or Flu B), while 358 (60.6%) showed negative results. Total 172 (73.8%) were positive for Flu A while 61 (26.1%) were positive for Flu B. Among Flu A cases, 107 (62.2%) were positive for H1N1. Most of the positive cases (n=206; 88.4%) were reported in the months of January and February during the three-year period (2016-2019) of this study.
Conclusions:Influenza virus has peak activity in the months of January and February. Both Influenza A and B are circulating in the environment but Flu A is predominant and H1N1 is more prevalent.
Key words: H1N1 stain, Influenza, Seasonal Flu trend.
Year 2018 marks a century to 1918 Influenza pandemic1 and we are almost still in the same boat as far as influenza spread is concerned. Influenza virus is one of the causes of global epidemics and affects up to 20% of the population in a season with significant morbidity and mortality2. It results in almost 3 to 5 million cases of severe illness, and 290,000 to 650,000 deaths globally each year3. People at higher risk are pregnant, elderly, children and chronically ill patients4. Influenza is a contagious infection, viral in origin and infects the respiratory system. It develops suddenly and patient feels symptoms of cough, sore throat, fever, chills, runny nose, body aches or fatigue. Mostly recovery occurs within a few days, but sometimes high-risk patients develop complications which may lead to secondary bacterial infections like myocarditis, asthma, myositis, sepsis or even death5. Severe influenza infection is treatable with antivirals, if treatment is started earlier. Timely treatment (within 48 hours of onset) with antivirals helps decreasing the severity of disease by reducing duration of illness and complications and may also reduce mortality, specifically among high-risk population6,7.
Influenza virus escapes our immune system by the process of antigenic shift and drift. There are four main genera of influenza viruses; A, B, C and D.2 The major cause of influenza pandemic is antigenic shift in influenza A virus.8 The emergence of new viral subtypes occurs due to two types of surface proteins; hemagglutinin (H) and the neuraminidase (N). There are 18 hemagglutinin and 11 neuraminidase subtypes circulating in wild birds9. But in mammals, few of these cause infections. Major pandemics were reported in 1918 (H1N1), 1957 (H2N2), 1968 (H3N2) and 2009 (H1N1)10.
Seasonal epidemic is caused by Human influenza A and B viruses. It occurs mainly due to antigenic drift and an individual can experience multiple episodes of influenza throughout life, due to this antigenic drift. The history of influenza epidemic shows that it can be devastating and can lead to multiple deaths and economic burden. Hence, this study was planned to recognize the peak activity time span of influenza infection, its frequency in our set-up and prevalence of H1N1 strain. This was important because there is lack of literature regarding Influenza in this part of the world. This information will be useful for clinicians in defining influenza management program and will help in prevention of spread of this deadly infection. Defining the time span of peak influenza activity in our set up can also contribute to determine the timings of implementation of influenza vaccine.
A cross sectional study was performed in the Pathology Laboratory, Shifa International Hospital Islamabad, Pakistan from April 2016 to March 2019. Permission for the study was obtained from the Institutional Review Board and Ethical Committee of Shifa International Hospital, Shifa Tameer-e-Millat University, Islamabad Pakistan. Nasopharyngeal swabs were collected from patients of all age groups (both genders) with clinically suspected influenza infection according to the hospital’s standard policy. Duplicate samples from the same patient were excluded from the study. Nasopharyngeal swabs were transported immediately to the laboratory in Universal Transport Medium (UTM) and stored at 2-8°C (up to 72 hours) till further processing. Specimen was checked for Influenza positivity by Cepheid Xpert Flu Assay (automated multiplex real-time RT-PCR) according to manufacturer's guidelines. Sample was mixed by inverting UTM five times and then transferred to cartridge through transfer pipette. Cartridge lid was opened. 300 ul of specimen, diluted in transport medium was transferred to cartridge. Cartridge lid was closed. After bar coding, typing of patient and sample ID, Xpert Flu Assay was scanned and test started. Sample processing control was run along with test. Results were interpreted automatically by GeneXpert instrument system from measured fluorescent signals and embedded calculation algorithms. Data collected was entered and then analysers in SPSS 17.0.
In the three-year study time period (April 2016 to March 2019), overall, 591 samples of clinically suspected patients from both inpatient and outpatient departments of Shifa International Hospital were collected and tested by Xpert Flu Assay. Out of those, 233 (39.4%) were positive for Flu A or Flu B while 358 (60.6%) showed negative results (Table I). Most of the positive cases (88.4 %) were reported in the months of January and February (Figure 1). Total 172 (73.8%) were positive for Flu A while 61 (26.1%) were positive for Flu B. Out of positive Flu A cases during the three-year period, 107 (62.2%) were positive for H1N1 (Table II).
Table I: Yearly distribution of Influenza positive cases |
||||
|
Total number of samples tested |
Total positive (%) |
Flu A (%) |
Flu B (%) |
April 2016- March 2017 |
31 |
11 (35.4) |
7 (63.6) |
4 (36.3) |
April 2017- March 2018 |
234 |
93 (39.7) |
81 (87) |
12 (13) |
April 2018- March 2019 |
326 |
129 (39.5) |
84 (65.1) |
45 (34.8) |
Total |
591 |
233 (39.4) |
172 (73.8) |
61 (26.1) |
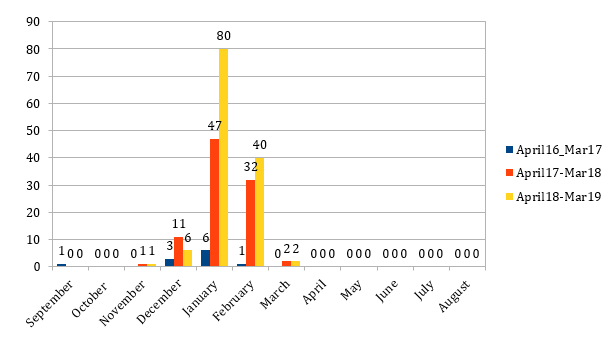
Figure 1: Monthly distribution of Influenza positive cases
Table II: H1N1 positive cases among Flu A positive |
||
Year |
Flu A positive |
H1N1 positive (%) |
April 2016- March 2017 |
7 |
0 |
April 2017- March 2018 |
81 |
42 (51.8) |
April 2018- March 2019 |
84 |
65 (77.3) |
Total |
172 |
107 (62.2) |
Data obtained through this study provides evidence that peak activity time period of influenza was in the months of January and February (88.4%). A Surveillance study was done to determine the seasonal activity of Influenza from 2011-2016 in six WHO regions. It indicated 6.1-month activity period of influenza in South East Asia Region11. Pakistan was not included in this study and there was no consistent peak activity observed in India, Bangladesh, Bhutan and Indonesia. Nepal and Thailand had two peak activity; March-April and July-August for Nepal and February-March and July-November for Thailand, respectively11.
In a study conducted in Indonesia from 2013-2016, 19% of patients with Severe Acute Respiratory Infection were positive for Influenza12. In another study by Mudhigeti et al. carried out in India from 2017-2018, 40% of influenza-suspected cases were positive for influenza13. These findings are similar to our data, as we had 39.4% cases positive for influenza among suspected cases.
In our study, samples were analysed through Cepheid Xpert Flu Assay which is a robust automated nucleic acid amplification based diagnostic test14. The sensitivity of the test is greater than culture techniques while its performance is comparable to that of molecular reference standards10. Cultures can be helpful for public health purposes but cannot provide timely result to help in patient management15. Rapid influenza diagnostic tests are also available but their sensitivity is low as compared to the molecular PCR-based techniques16.
A surveillance study done at National influenza center in Islamabad Pakistan in collaboration with all provinces from 2008-2011, revealed 24% positive influenza cases among suspected cases17. They reported that influenza A cases were predominant (72%) with H1N1 as the most common subtype (82%). We also reported 73% influenza A cases with 62% H1N1 strain in our study. Interestingly most cases were from the Federal capital (Islamabad) (53%). The study also stressed upon the need for continuous surveillance of influenza17.
It is a frequent practice to treat flu-like symptoms without laboratory diagnosis, however confirming the diagnosis aids in decreasing overall hospital stay, treatment cost, unnecessary antibiotics, morbidity and mortality related to infection and better chance of getting prompt treatment and implementation of infection control measures18. It also helps hospital to get prepared for seasonal infection. In 1918 pandemic, there was little knowledge about influenza but now we have reached the Era when we have diagnostic facilities, antivirals drugs and influenza vaccines available19.
In the light of this study, the peak activity time span of influenza in Islamabad was documented. Knowing the epidemic strain and season of its prevalence in our set-up can help in starting vaccine campaigns before the peak season, giving information to drug manufacturers for upcoming increased requirement in supply and providing awareness to public regarding its spread and implementation of control measures on an individual basis20. We can try to minimize the spread of infection and can help in reducing death rates due to influenza.
The main limitation of this study was that data was obtained from a single center in Islamabad, therefore, these findings cannot be generalized. Collection of data from different laboratories of Pakistan will help in recognising trends in the whole country. Further, enhanced surveillance in different regions of Pakistan can also help in optimising efforts for management of the infection.
Influenza virus places a substantial burden on health management in our set up with the peak activity in the months of January and February. Both Influenza A and B are circulating in the environment, but Flu A is predominant and H1N1 is prevalent.
It is needful to minimize the impact of this inevitable epidemic by available means. Timely diagnosis and knowing frequency, duration and peak season helps in defining influenza management program. Continuous surveillance from all regions of the country is required for optimal management of influenza infection.
- Short KR, Kedzierska K, Sandt CE. Back to the Future: Lessons Learned from the 1918 Influenza Pandemic. Front Cell Infect Microbiol. 2018; 8: 343. Doi: 10.3389/fcimb.2018.00343.
- Thompson WW, Shay DK, Weintraub E et al Mortality associated with influenza and respiratory syncytial virus in the United States. JAMA. 2003; 289(2): 179–86. Doi: 10.1001/jama.289.2.179.
- Iuliano AD, Roguski KM, Chang HH, Muscatello DJ, Palekar R, Tempia S, et al. Estimates of global seasonal influenza-associated respiratory mortality: a modelling study. Lancet. 2018; 391(10127): 1285-1300. Doi: 10.1016/S0140-6736(17)33293-2.
- Taubenberger JK and Morens DM. The Pathology of Influenza Virus Infections. Annu Rev Pathol. 2008; 3:499-522. Doi: 10.1146/annurev.pathmechdis.3. 121806.154316.
- Sellers SA, Hagan RS, Hayden FG, Fischer WA. The hidden burden of influenza: A review of the extra-pulmonary complications of influenza infection. Influenza Other Respir Viruses. 2017; 11(5): 372–93. Doi: 10.1111/irv.12470.
- Davidson S. Treating Influenza Infection from Now and into the Future. Front Immunol. 2018; 9: 1946. Doi: 10.3389/fimmu.2018.01946.
- Uyeki TM, Bernstein HH, Bradley JS, Englund JA, File TM, Fry AM, et al. Clinical Practice Guidelines by the Infectious Diseases Society of America: 2018 Update on Diagnosis, Treatment, Chemoprophylaxis, and Institutional Outbreak Management of Seasonal Influenza. Clin Infect Dis. 2019; 68(6): 1-47. Doi: 10.1093/cid/ciy866.
- Webster RG, Govorkova EA. Continuing challenges in influenza. Ann N Y Acad Sci. 2014; 1323(1):115-39. Doi: 10.1111/nyas.12462.
- Sleman SS. How Influenza A Virus Causes ‘‘Epidemics’’ and ‘‘Pandemics’’ among the Populations? J Infect Dis Ther. 2017; 5: 319. Doi: 10.4172/2332-0877.1000319.
- Cohen DM, Kline J, May LS, Hamett GE, Gibson J, Liang SY, et al. Accurate PCR Detection of Influenza A/B and Respiratory Syncytial Viruses by Use of Cepheid Xpert Flu+RSV Xpress Assay in Point-of-Care Settings: Comparison to Prodesse ProFlu. J Clin Microbiol. 2018; 56(2): e1237-17. Doi: 10.1128/JCM.01237-17.
- Newman LP, Bhat N, Fleming JA, Neuzil KM. Global influenza seasonality to inform country-level vaccine programs: An analysis of WHO FluNet influenza surveillance data between 2011 and 2016. PloS ONE. 2018; 13(2): e0193263. Doi: 10.1371/journal.pone.0193263.
- Susilarini NK, Haryanto E, Praptiningsih CY, Mangiri A, Kipuw N, Taraya I et al. Estimated incidence of influenza-associated severe acute respiratory infections in Indonesia, 2013-2016. Influenza Other Respir Viruses. 2018; 12(1): 81–7. Doi: 10.1111/irv.12496.
- Mudhigeti N, Racherla RG, Mahalakshmi PA, Pamireddy M L, Nallapireddy U, Kante M et al. A study of influenza 2017–2018 outbreak in Andhra Pradesh, India. Indian J Med Microbiol. 2018; 36(4): 526-31. Doi: 10.4103/ijmm.IJMM_18_272.
- Haglund S, Quttineh M, Nilsson BA, Matussek A, Henningsson AJ. Xpert Flu as a rapid diagnostic test for respiratory tract viral infection: evaluation and implementation as a 24/7 service. Infect Dis. 2018; 50(2): 140-4. Doi: 10.1080/23744235.2017.1380841.
- Merckx J, Wali R, Schiller I, Caya C, Gore GC, Chartrand C, et al. Diagnostic Accuracy of Novel and Traditional Rapid Tests for Influenza Infection Compared with Reverse Transcriptase Polymerase Chain Reaction: A Systematic Review and Meta-analysis. Ann Intern Med. 2017; 167(6): 394-409. Doi: 10.7326/M17-0848.
- Influenza (Seasonal) [internet]. Available from: https://www.who.int/news-room/fact-sheets/detail/influenza-%28seasonal%29 [cited September 2019]
- Badar N, Aamir UB, Mehmood MR, Nasir N, Alam MM, Kazi BM, et al. Influenza virus surveillance in Pakistan during 2008-2011. PLoS One. 2013; 8(11): e79959. Doi: 10.1371/journal.pone.0079959.
- Weekely SMN, Marlowe EM, Poulter M, Dwyer D, Speers D, Rawlinson W, et al. Evaluation of the Cepheid Xpert Flu Assay for Rapid Identification and Differentiation of Influenza A, Influenza A 2009 H1N1, and Influenza B Viruses. J Clin Microbiol. 2012; 50(5): 1704–10. Doi: 10.1128/JCM.06520-11.
- Taubenberger JK and Morens DM. 1918 Influenza: The Mother of All Pandemics. Emerg Infect Dis. 2006; 12(1): 15–22. Doi: 10.3201/eid1201.050979.
- Grohskopf LA, Sokolow LZ, Broder KR, Walter EB, Bresee JS, Fry AM, et al. Prevention and Control of Seasonal Influenza with Vaccines: Recommendations of the Advisory Committee on Immunization Practices---United States, 2017–18 Influenza Season. MMWR Recomm Rep. 2017; 66(2): 1-20. Doi: 10.15585/mmwr.rr6602a1.

An Official Publication of
Islamabad Medical & Dental College
Volume 10 Issue 1
Author's Contribution:
1-3Conception; Literature research; manuscript design and drafting; Critical analysis and manuscript review; 4Data analysis; Manuscript Editing.
Article info:
Received: March 29, 2019
Accepted: May 18, 2020
Funding Source: Nil
Conflict of Interest: Nil
Address of Correspondence
Waseem Akhter
Email:
wsmakhter@yahoo.com
Cite this article. Akhter W, Yousafzai E, Rana AM, Anwar S. Refractive Errors: Prevalence and Pattern among Rural Population of Islamabad, Pakistan.
J Islamabad Med Dental Coll.2020; 9(2): 103-108.
Doi: 10.35787/jimdc.v9i2.326